

Translate this page into:
Stress among doctors: A cross-sectional study in a tertiary care hospital, North India

*Corresponding author: Prabhjot Kaur, Department of Community Medicine, Adesh Institute of Medical Sciences and Research, Adesh University, Guru Teg Bahadur Nagar, Handiaya Road, Barnala - 148101, Punjab, India. drprabhjot27@gmail.com
-
Received: ,
Accepted: ,
How to cite this article: Sidhu TK, Kaur P, Kaur H, Kaur K. Stress among doctors: A cross-sectional study in a tertiary care hospital, North India. Adesh Univ J Med Sci Res 2021;3(1):18-24.
Abstract
Objectives:
The objectives of the study were as follows: 1. To study the prevalence of stress among doctors. 2. To find the association of stress and its risk factors.
Materials and Methods:
Institution based cross-sectional study was conducted in the tertiary hospital of Punjab. Pre-validated questionnaire was used to assess the demographic variables and stress factors. Perceived Stress Scale-10 was used to assess the stress levels among the doctors.
Results:
Of the 203 participants, females (54.7%) outnumbered the males. Mean scores for the stress scale was 18.40±5.4. Majority of the participants (79.8%) were having moderate stress levels. Statistically significant higher stress levels were found in female doctors (P-value = 0.009) and in the age category of 31-40 years (P-value= 0.04). Emergency duties, intra-departmental working environment, being away from family, not able to have proper personal and family time, lack of sleep were the main risk factors to cause increased stress among doctors. Listening to the music was found to be the main stress buster.
Conclusion:
Proper rest and involvement into stress relieving activities like meditation and yoga, conducive working environment are the need of the hour for the burnt-out healthcare providers.
Keywords
Stress
Doctors
Stress-relievers

INTRODUCTION
The modern medical workplace is a complex environment, and doctors respond differently to it, some finding it stimulating and exciting, whereas others become stressed and feel burnt-out from the heavy workload.[1] Burnout is considered as a distinct state of psychological stress generated by the individual’s occupation and/or workplace and is identified as such in the World Health Organization’s International Classification of Diseases.[2,3] The prevalence of burnout has been found to be as high as 75% among doctors.[4]
Workplace stress affects the performance of the brain, including functions of work performance memory, concentration, and learning. Although small amount of stress can have positive effects by energizing people toward goals, excessive stress may seriously and negatively affect a person’s health and job performance. Hospitals are no exceptions; doctors are life savers, and if they come under stress, their efficiency is reduced, directly affecting the lives of a large number of people whom they treat. Stress may originate from personal and professional life of the person, affecting that person as a whole. Occupational stress occurs when job-related factors interact with individual factors, resulting in a change in the individual’s psychological and/or physiological state.[5] Stress is closely related to the amount of psychosocial resources that are possessed or thought to be possessed to cope with the requirements of certain demanding situations.[6] At an individual level, burnout among doctors has been associated with lower career satisfaction, higher absenteeism, greater probability of leaving the profession prematurely or choosing early retirement, and greater risk of experiencing difficulties in interpersonal relationships, such as with family and partners.[7,8] All these factors affect the working capacity and efficiency of the health-care providers and thus have a deteriorating effect on the doctors, hospitals, and the patients. As stress among doctors is not taken into much consideration and often a neglected topic, so this study was planned with objectives of estimating the prevalence of stress among doctors in our region and to find the associated risk factors for the same.
MATERIALS AND METHODS
A cross-sectional study was conducted by including all the doctors from all the departments of a tertiary care institution. Complete enlistment procedure was followed for the enrolment of the participants which included junior residents, postgraduate residents, senior residents, consultants, professors, and head of the department. Out of the total list, 203 participants responded and included in this research work. However, those who were not available and did not consent to participate were excluded from the study.
Sample size
According to a study conducted among private medical practitioners in Vellore District, Tamil Nadu, the prevalence of high job stress was found to be 35.5% in doctors.[9] Using the formula n = Z2 p(1-p)/d2 (where Z = 1.96 at 95% confidence interval, p = expected prevalence, d = relative precision – 20% of the expected prevalence, i.e., 7%) and taking the prevalence as above mentioned, minimum sample size came out to be 180. On adding 10% for the incomplete proforma, a sample size of 200 was taken for this study.
Methodology
A structured, pre-validated, self-administered questionnaire was used to evaluate the demographic variables and the factors related to the stress in the medical professionals [ANNEXURE 1]. Perceived Stress Scale-10 (PSS-10) was used to find out the levels of the stress in the doctors based on the perceptions about their life according to their past 1 month experience.[10] All those who were willing to participate and were the employee of the institution were enrolled in the study. Incomplete proforma and those doctors who could not be contacted in three consecutive visits were excluded from the study. Data collected were analyzed using the Microsoft Excel spreadsheet (version 2010). Demographic variables were mentioned in terms of frequency and percentages. PSS scores were obtained by reversing responses (e.g., 0 = 4, 1 = 3, 2 = 2, 3 = 1, and 4 = 0) to the four positively stated items (items 4, 5, 7, and 8) and then summing across all scale items. Scores obtained were mentioned as means and categorization of the stress levels was done according to the protocol (scores of 0–13 - low stress levels, 14–26 score - moderate stress levels, and 27–40 scores - high perceived stress levels). Chi-square, t-test, and one-way ANOVA were used to find out the association of the stress levels with the different demographic variables.
Ethical consideration
The study was initiated after taking the ethical approval from the Institutional Ethics Committee. Informed verbal consent was taken from each participant after briefing them about the type of the research and assuring the anonymity of the data collected.
RESULTS
In this study, a total of 203 participants were evaluated. Females (54.7%) outnumbered the males (45.3%). Mean age the participants was found to be 35.83 + 12.92 years. Mean of total number of years in the job was 9.8 years, however, mean years of present job were 3.2 years [Table 1].
| Variable | Subgroup | Frequency (n=203) | Percentage |
|---|---|---|---|
| Gender | Male | 92 | 45.3 |
| Female | 111 | 54.7 | |
| Age category (in years) | 20–30 | 96 | 47.3 |
| 31–40 | 56 | 27.6 | |
| 41–50 | 25 | 12.3 | |
| 51–60 | 05 | 2.5 | |
| 61–70 | 21 | 10.3 | |
| Working as | JR | 59 | 29.1 |
| PG | 24 | 11.8 | |
| SR | 25 | 12.3 | |
| AP | 40 | 19.7 | |
| Associate | 21 | 10.3 | |
| Professor | 24 | 11.8 | |
| HOD | 10 | 4.9 | |
| Department | Non-clinical | 83 | 40.9 |
| Clinical | 120 | 59.1 | |
| Marital status | Married | 130 | 64 |
| Unmarried | 73 | 36 |
More number of females were found in the non-clinical branches (included both pre-clinical and paraclinical branches); on the other side, males outnumbered the females in the clinical field [Figure 1].

- Gender distribution according to department.
In our study, median screen time of the study participants was found to be 3 h, with range of ½–12 h. Maximum participants (94.6%) claimed of not having any addiction habits followed by alcohol addiction (4.4%) and smoking (1%).
Stress levels were assessed using the PSS-10 on the basis of their past 1 month experience. Mean score was found 18.40 ± 5.4 with a range of 2–35. Majority (79.8%) of the participants were having moderate stress levels followed by low stress levels (13.8%) and high perceived stress was found in 6.4% of the medical professionals [Table 2].
| Stress levels | Frequency (n=203) | Percentage |
|---|---|---|
| Low stress (0–13) | 28 | 13.8 |
| Moderate stress (14–26) | 162 | 79.8 |
| High perceived stress (27–40) | 13 | 6.4 |
Association of the mean stress scores with-in different demographic variables was calculated using unpaired t-test. Females showed higher stress levels, which were statistically significant with P < 0.05. However, department (clinical/ non-clinical) and marital status of the participants had no association with the stress levels [Table 3].
| Variable | Subgroup | Mean±2SD | t | P value |
|---|---|---|---|---|
| Gender | Male | 17.30±5.783 | −2.653 | 0.009** |
| Female | 19.32±5.016 | |||
| Department | Non-clinical | 18.55±5.886 | 0.326 | 0.745 |
| Clinical | 18.30±5.162 | |||
| Marital status | Married | 17.92±5.311 | −1.710 | 0.089 |
| Unmarried | 19.27±5.640 |
Association of the mean stress scores with age categories, designation, and addiction habits of the participants was calculated using the one-way ANOVA test. Statistical significant stress levels were found in the age category of 31–40 years of age (P = 0.04). This phase is settlement phase/ phase of establishment after the postgraduation, thus adding to the stress levels of the doctors. Post hoc Bonferroni test was run to find out the intergroup differences in the age categories. The age group of 51–60 years had statistically significant lower stress levels as compared to the age groups of 20–30 years and 31–40 years. However, no other age group showed such difference. The designation of the participants and addiction habits had no impact on the stress levels of the individuals [Table 4].
| Variable | Subgroup | Mean±2SD | F | P value |
|---|---|---|---|---|
| Age category (in years) | 20–30 | 19.13±4.878 | 4.037 | 0.04* |
| 31–40 | 19.14±6.083 | |||
| 41–50 | 17.56±4.454 | |||
| 51–60 | 12.20±8.672 | |||
| 61–70 | 15.62±4.944 | |||
| Designation | JR | 19.31±5.754 | 0.890 | 0.503 |
| PG | 19.21±3.956 | |||
| SR | 17.96±5.682 | |||
| AP | 18.60±5.555 | |||
| Associate | 16.90±7.006 | |||
| Professor | 17.38±4.614 | |||
| HOD | 17.10±3.725 | |||
| Addiction habits | No addiction | 18.40±5.545 | 0.270 | 0.840 |
| Alcohol | 17.22±4.711 | |||
| Smoking | 19.00±1.414 | |||
| Others | 19.63±5.125 |
Correlation of the mean stress scores was found non-significant both with the number of years in job (r = −0.067, P = 0.340) and screen time of the participants (r = 0.060, P = 0.392). However, many other factors in this study were found to be statistically significant in increasing the stress levels among doctors. Professional factors included emergency duties and intradepartmental working environment, which causes significant stress among the doctors. However, problems in the personal life such as staying away from the family, not able to give adequate time to their family life, any sickness in the family, lack of proper sleep and rest, and not having time to pursue their hobbies – all induces stress among the medical personnel [Table 5].
| Question | Low stress levels (%) | Moderate stress levels (%) | High perceived stress (%) | Chi-square value | Pvalue |
|---|---|---|---|---|---|
| Q 1. Do sick patients raise your stress levels? | 6 (8.4) | 59 (83.2) | 6 (8.4) | 3.659 | 0.454 |
| Q 2. Do critically sick patients cause a stress? | 8 (7.6) | 92 (87.6) | 5 (4.8) | 8.789 | 0.067 |
| Q 3. Do you get upset with night shifts? | 5 (6.4) | 66 (84.6) | 7 (9.0) | 8.377 | 0.079 |
| Q 4.Do emergency services leaves you exhausted? | 3 (4.0) | 68 (89.4) | 5 (6.6) | 10.065 | 0.039* |
| Q 5. Is dealing with the patient’s relatives is a stress inducer for you? | 4 (6.0) | 56 (83.6) | 7 (10.4) | 8.196 | 0.085 |
| Q 6. Do inadequate or late wages makes you upset? | 20 (12.5) | 130 (81.2) | 10 (6.3) | 1.142 | 0.565 |
| Q 7. Do increased working hours more than 8 h make you restless? | 14 (11.3) | 105 (84.7) | 5 (4.0) | 5.194 | 0.074 |
| Q 8. Does pressure from superiors affect your mood? | 14 (10.6) | 107 (81.1) | 11 (8.3) | 5.048 | 0.080 |
| Q 9. Does intradepartmental work environment causes stress? | 9 (9.0) | 78 (70.0) | 13 (13.0) | 16.753 | 0.000230** |
| Q 10. Getting job done from subordinates is a difficult task? | 7 (9.7) | 61 (84.7) | 4 (5.6) | 1.804 | 0.406 |
| Q 11. Is there any gender harassment in your working place? | 1 (7.7) | 11 (84.6) | 1 (7.7) | 2.224 | 0.329 |
| Q 12. Do you feel competition from your colleagues? | 4 (9.1) | 39 (88.6) | 1 (2.3) | 2.947 | 0.229 |
| Q 13. Does staying away from family makes you distressed? | 9 (7.9) | 94 (82.5) | 11 (9.6) | 11.118 | 0.025* |
| Q 14. Are you able to give proper time to your family life? | 23 (19.6) | 89 (76.1) | 5 (4.3) | 9.328 | 0.009** |
| Q 15. Are you able to attend social functions? | 19 (16.2) | 92 (78.6) | 6 (5.2) | 1.947 | 0.378 |
| Q 16. Is there any sickness in your family affects your performance? | 12 (13.2) | 69 (75.8) | 10 (11.0) | 5.786 | 0.055* |
| Q 17. Are you suffering from any lifestyle-related disorder? | 4 (11.4) | 28 (80.0) | 3 (8.6) | 0.482 | 0.786 |
| Q 18. Are you suffering from lack of proper rest and sleep? | 5 (6.3) | 63 (79.7) | 11 (14.0) | 16.645 | 0.000243** |
| Q 19. Are you able to take proper nutrition? | 23 (16.5) | 110 (79.1) | 6 (4.4) | 5.448 | 0.066 |
| Q 20. Do you feel increasing age affects your mood? | 6 (9.0) | 53 (79.1) | 8 (11.9) | 6.490 | 0.039* |
| Q 21. Do you find time to pursue your hobbies? | 22 (22.7) | 72 (74.2) | 3 (3.1) | 14.542 | 0.001** |
In the present study, listening to the music was found to be the most common stress reliever followed by exercise. However, multiple options were being used by the participants to overcome their stress [Figure 2]. Other stress relievers included –spiritual activities, watching TV, hobbies shopping, relaxation activities, and spending time with family members.
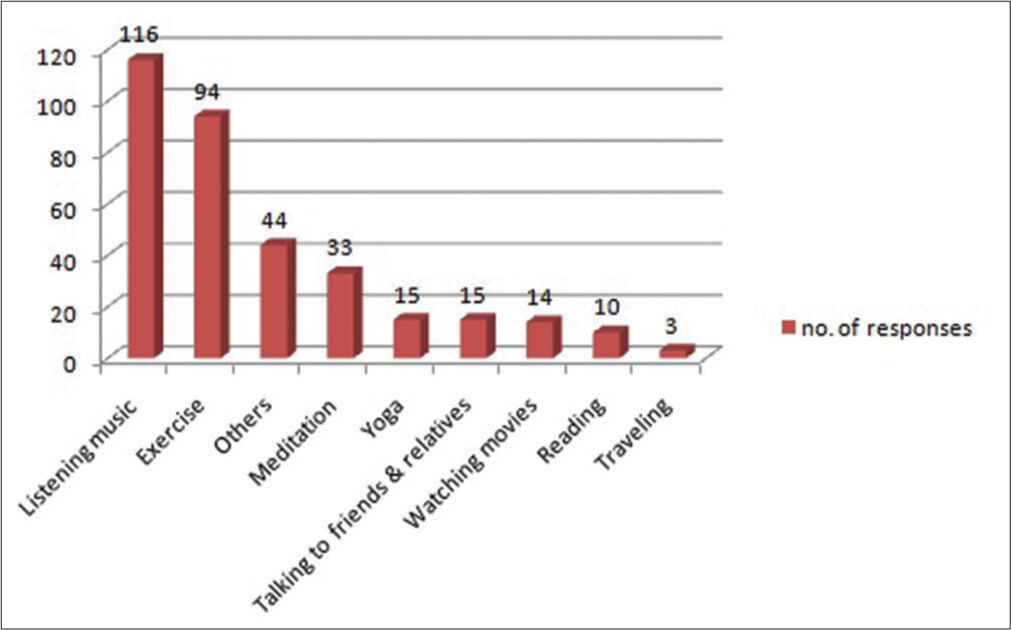
- Stress relievers among participants.
DISCUSSION
In the present study, a total of 203 participants were evaluated; majority being the females (54.7%). Maximum were in the age category of 20–30 years (47.3%) with mean age of 35.83 + 12.92 years. However, in other similar studies conducted in India, maximum participants were males and age group of 25–35 years was the most common age category.[11-13]
In our study, stress levels were assessed using PSS-10 scale and mean stress scores were found 18.40 ± 5.4. Majority (79.8%) of the participants were having moderate stress levels. Statistically significant of the stress levels was found in female doctors (P = 0.009) and in the age category of 31–40 years (P = 0.04). Emergency duties, intradepartmental working environment, being away from family, not able to have proper personal and family time, and lack of sleep were the main factors to cause increased stress among doctors.
However, in a study conducted by Sathiya et al., stress levels of the doctors were compared with the nurses. This study concluded that higher stress levels were found in the doctors with mean scores of 18.35 (± 4.7). Inadequacies of staff and resources, sleep deprivation, confronting constant emotional assault, smoking, and physical suffering were found as important stressors. Gender was not associated with stress levels of the participants.[12] In another conducted by Khoo et al. in Malaysia, taking pediatricians as the study participants, more emotional breakdown was found in the junior/fresher doctors with the main reason of stress to establish themselves in the field. Other sources of the stress “dealing with difficult parents” (80.2%), “feeling of inadequate knowledge to meet work demands” (72.6%), “crowded wards” (70.6%), “fear of medicolegal issues” (70.1%), and “dealing with acute intensive care children” (68.5%). Workplace factors such as unrealistic goals and disrespectful interactions with colleagues or subordinates were significantly associated with emotional exhaustion.[14]
The stress levels were seen higher in the doctors those who were in the beginning phase of their careers. In a study conducted by Shriram et al., male medical interns showed higher levels of the PSS-10 scores as compared to female counterparts.[15] In similar study conducted by Chatterjee in 2020, clinical interns showed maximum levels of the stress with mean scores of 20.4 ± 5.2 followed by house residents (17.5 ± 5.1).[13] This showed that beginning of the career induces more stress to the health-care providers. Similar findings were seen in the studies conducted by Sahasrabuddhe et al.[1] and Lorga et al.[16] In other study, main stress factors were mentioned as heavy work load with long duty hours (48.3%), poor accommodation and food (32%), low stipend (41%), and lack of social and family life (22.8%).[1] However, physical environment, work volume, poor pay, lack of appreciation, lack of support, opportunities, promotion, patient expectation, and deadline were the main stressors in the study conducted taking Iran doctors as the participants.[17]
In our study, only 4.4% of participants claimed of having alcohol addiction followed by smoking habits. Similar findings of the vicious cycle of stress, alcohol, and smoking were seen in a study conducted by Sathiya et al. and Lorga et al.[12,16] In our study, listening to the music was found to be stress reliever followed by majority of the participants. In a study conducted by Prasad et al., before and after stress evaluation were done in the doctors after the 6-week yoga and meditation program.[18] It showed improvement in the inner content, happiness, confidence levels, patience, and reduced fatigue in the participants. In a systematic review, experts have emphasized on the support-based interventions to facilitate the development of the meaningful strategies for managing occupational stress in the longer term, to assist medical doctors in coping with work that is, by its nature, inherently challenging.[19]
Limitations
Subjective variations of the individuals could be the possible limiting factor of this study. Sample size was not that large, moreover, only one tertiary center covered. Multicentric study along with relaxing intervention provisions in between would have better future option.
CONCLUSION
Moderate stress levels were found in this study, thus affecting the doctors in various ways. Proper rest and involvement into stress-relieving activities such as meditation and yoga and conducive working environment are the need of the hour for the burnout health-care providers.
Declaration of patient consent
The authors certify that they have obtained all appropriate patient consent.
Financial support and sponsorship
Nil.
Conflicts of interest
There are no conflicts of interest.
References
- Stress among doctors doing residency: A cross-sectional study at a tertiary care hospital in the city of Mumbai. Natl J Community Med. 2015;6:21-4.
- [Google Scholar]
- International Statistical Classification of Diseases and Related Health Problems. 2016. Geneva: World Health Organization; Available from: https://www.apps.who.int/iris/handle/10665/246208 [Last accessed on 2021 Feb11]
- [Google Scholar]
- The relationship between job stress, burnout and clinical depression. J Affect Disord. 2003;75:209-21.
- [CrossRef] [Google Scholar]
- Burnout and psychiatric morbidity in new medical graduates. Med J Aust. 2004;181:357-60.
- [CrossRef] [PubMed] [Google Scholar]
- Effects of occupational stress management intervention programs: A meta-analysis. J Occup Health Psychol. 2008;13:69.
- [CrossRef] [PubMed] [Google Scholar]
- Health psychology: Psychological factors and physical disease from the perspective of human psychoneuroimmunology. Annu Rev Psychol. 1996;47:113-42.
- [CrossRef] [PubMed] [Google Scholar]
- Association of an educational program in mindful communication with burnout, empathy, and attitudes among primary care physicians. JAMA. 2009;302:1284-93.
- [CrossRef] [PubMed] [Google Scholar]
- Physician wellness: A missing quality indicator. Lancet. 2009;374:1714-21.
- [CrossRef] [Google Scholar]
- A study on job stress among private medical practitioners in Vellore district, Tamil Nadu. Asian J Sci Res. 2014;7:488-500.
- [CrossRef] [Google Scholar]
- A global measure of perceived stress. J Health Soc Behav. 1983;24:385-96.
- [CrossRef] [PubMed] [Google Scholar]
- Correlation among perceived stress, emotional intelligence, and burnout of resident doctors in a medical college of West Bengal: A mediation analysis. Indian J Public Health. 2018;62:27-31.
- [Google Scholar]
- Perceived stress levels and its sources among doctors and nurses working in a tertiary care teaching Hospital, Kancheepuram, Tamil Nadu. Natl J Community Med. 2016;7:603-8.
- [Google Scholar]
- A cross sectional study on stress among doctors, working in college of medicine and Sagore Dutta Hospital, Kamarhati, India. Int J Adv Med. 2020;7:517-22.
- [CrossRef] [Google Scholar]
- Emotional exhaustion is associated with work related stressors: A cross-sectional multicenter study in Malaysian public hospitals. Arch Argent Pediatr. 2017;115:212-9.
- [CrossRef] [Google Scholar]
- Depressed as freshmen, stressed as seniors: The relationship between depression, perceived stress and academic results among medical students. Behav Sci (Basel). 2018;8:70.
- [CrossRef] [PubMed] [Google Scholar]
- Role of occupational stressors among Iranian doctors at hospitals in Tehran Province, Iran. Int Trans J Eng Manag Appl Sci Technol. 2019;10:1-7.
- [Google Scholar]
- Medical students' stress levels and sense of well being after six weeks of yoga and meditation. Evid Based Complementary Altern Med. 2016;2016:1-7.
- [CrossRef] [PubMed] [Google Scholar]
- Psychosocial interventions for managing occupational stress and burnout among medical doctors: A systematic review. Syst Rev. 2017;6:144.
- [CrossRef] [PubMed] [Google Scholar]
ANNEXURE 1 – PERCEIVED STRESS SCALE
PSS-10 Item Instructions: The questions in this scale ask you about your feelings and thoughts during the past month. In each case, please indicate with a check how often you felt or thought a certain way.
In the past month, how often have you been upset because of something that happened unexpectedly? ___0=never ___1=almost never ___2=sometimes ___3=fairly often ___4=very often In the past month, how often have you felt that you were unable to control the important things in your life? ___0=never ___1=almost never ___2=sometimes ___3=fairly often ___4=very often In the past month, how often have you felt nervous and “stressed”? ___0=never ___1=almost never___2=sometimes ___3=fairly often ___4=very often In the past month, how often have you felt confident about your ability to handle your personal problems? ___0=never ___1=almost never ___2=sometimes ___3=fairly often ___4=very often In the past month, how often have you felt that things were going your way? ___0=never ___1=almost never___2=sometimes ___3=fairly often ___4=very often In the past month, how often have you found that you could not cope with all the things that you had to do? ___0=never ___1=almost never ___2=sometimes ___3=fairly often ___4=very often In the past month, how often have you been able to control irritations in your life? ___0=never ___1=almost never___2=sometimes ___3=fairly often ___4=very often In the past month, how often have you felt that you were on top of things? ___0=never ___1=almost never ___2=sometimes ___3=fairly often ___4=very often In the past month, how often have you been angered because of things that were outside of your control? ___0=never ___1=almost never ___2=sometimes ___3=fairly often ___4=very often In the past month, how often have you felt difficulties were piling up so high that you could not overcome them? ___0=never ___1=almost never ___2=sometimes ___3=fairly often ___4=very often
PSS-10 scores are obtained by reversing the scores on the four positive items, for example, 0 = 4, 1 = 3, 2 = 2, etc., and then summing across all 10 items. Items 4, 5, 7, and 8 are the positively stated items.