

Translate this page into:
Accuracy of ECG left ventricular hypertrophy (LVH) criteria compared to echocardiographic LVH among hypertensives in an African population


*Corresponding author: Murtala Audu Ngabea, Department of Medicine, Maitama District Hospital, Abuja, Nigeria. ngabea@yahoo.com
-
Received: ,
Accepted: ,
How to cite this article: Ngabea MA, Akor AA, Habib ZG, Umar H. Accuracy of ECG left ventricular hypertrophy (LVH) criteria compared to echocardiographic LVH among hypertensives in an African population. Adesh Univ J Med Sci Res 2022;4:72-9.
Abstract
Objectives:
Hypertension remains one of the important risk factors for cardiovascular diseases and a major global public health problem. The left ventricular hypertrophy is a recognized complication of systemic hypertension and strongly predicts cardiovascular morbidity and mortality. In Nigeria, few studies have evaluated the accuracy of multiple electrocardiography (ECG) criteria in the diagnosis of the left ventricular hypertrophy among hypertensives. This study sets out to determine ECG criterion or criteria that define most accurately echocardiographic left ventricular hypertrophy (LVH) among patients with hypertension in a tertiary health institution in Nigeria.
Materials and Methods:
One hundred and seventy-eight hypertensives and 89 age- and sex-matched controls were recruited consecutively into the study. All participants including hypertensives and control subjects had echocardiography whereas only hypertensive subjects had both echocardiography and ECG. ECG LVH was determined using various ECG criteria.
Results:
The various ECG criteria for diagnosis of LVH were lower in sensitivities (23.5–38.6%) compared to specificities (64.1–72.9%). The sensitivities and specificities were 28.9% and 64.0%, 38.6% and 72.9%, 23.5% and 64.1%, 34.6% and 69.4%, 34.4% and 68.0%, and 38.6% and 72.9% for Sokolow-Lyon, Cornell voltage, Romhilt-Estes, Cornell duration product, Goldberger, and Massoleini criteria, respectively. The areas under the various receiver operating characteristic (ROC) curves were 0.7010, 0.6040, 0.5960, 0.5950, 0.4790, and 0.4660 for Sokolow-Lyon, Cornell voltage, Massoleini, Romhilt-Estes, Goldberger, and Cornell product duration criteria, respectively.
Conclusion:
Cornell voltage, Sokolow-Lyon, and Massoleini ECG criteria had the highest combination of sensitivities and specificities with the highest ROC values and thus most accurate ECG LVH criteria
Keywords
Electrocardiography
Left ventricular hypertrophy
hypertension
Echocardiography

INTRODUCTION
Hypertension is defined as persistent systolic blood pressure (BP) of >140 mmHg and/or diastolic BP of 90 mmHg or higher.[1] It remains one of the most important risk factors for cardiovascular disease and a major global public health problem.[2] At present, the management of hypertension has gone beyond mere lowering of BP to manipulation of the risk factors that have been clearly associated with increased morbidity and mortality.[3] The left ventricular hypertrophy (LVH) is one of these risk factors.[4]
LVH is a recognized complication of systemic hypertension and the best studied marker of hypertensive heart disease.[5] It refers to abnormal increase in the mass of the left ventricular myocardium caused by a chronically increased workload on the heart which may be directly due to hypertension.[6] Increased workload on the heart causing LVH can also be caused by comorbid conditions such as obesity, chronic kidney disease, and diabetes mellitus. LVH is, however, a modifiable risk factor as treatment causes its regression, thereby decreasing the rate of adverse cardiovascular events and improving survival independent of degree of BP lowering hence the need for its early diagnosis.[7]
Prevalence of LVH among hypertensive varies widely between 20% and 50% depending on the population and tool applied for diagnosis.[8]
The LVH strongly predicts cardiovascular morbidity and mortality in hypertensive patients and is also an independent risk factor for overall cardiovascular mortality and morbidity.[9] It is an important factor used for risk stratification of hypertensives[10] and is known to cause reduction in myocardial coronary reserve, predisposes to myocardial ischemia and left ventricular dysfunction, thereby causing increased incidence of coronary heart disease among hypertensives.[11] It has been determined that there is a 4–8-fold increase in the chance of strokes after adjusting for an increase in BP among hypertensives with LVH compared to those without it.[12]
The LVH can be diagnosed by electrocardiography (ECG).[13] In spite of low sensitivity of ECG criteria ranging from 7% to 35% in mild hypertension and 10–50% in moderate/severe hypertension,[14] it is still the affordable diagnostic tool of LVH in Nigeria and many parts of the developing world. Although echocardiography is sensitive in diagnosing LVH, it is not yet widely available in many developing countries.[6]
Some studies in recent time have evaluated accuracy of ECG LVH criteria compared to echocardiographic LVH but these have however been limited by the use of few ECG LVH criteria. Thus, there is a need for more data appraising ECG LVH diagnosis in Nigeria. This study determined accuracy of various ECG criteria for LVH compared to echocardiographic LVH using multiple ECG criteria.
MATERIALS AND METHODS
This was a prospective cross-sectional and descriptive study where a total of 178 subjects and 89 age- and sex-matched controls were recruited. Consecutive eligible adult hypertensive subjects seen at the cardiology clinic of the medical outpatient department of University of Abuja Teaching Hospital (UATH) were enrolled.
Controls were only recruited so that a reference or cutoff echocardiographic left ventricular mass (LVM) can be calculated from their echocardiographic values. The value was 231.2 g and 168.2 g for males and females controls, respectively. All hypertensive subjects whose echocardiographic LVM exceeded these values were deemed to have echocardiographic LVH in this study.
A subject was considered hypertensive if the BP measured on two or three occasions of at least 5 min apart was consistently greater than or equal to 140 mmHg systolic and/ or ≥90 mmHg diastolic or patients already on treatment for hypertension. Consenting adults aged above 18 years with systemic hypertension were enrolled while hypertensives with chronic kidney disease, anemia, valvular heart disease, diabetes, and pregnancy were excluded from the study. Control population were chosen among apparently healthy volunteers consisting of nurses, doctors, other hospital workers, and patient relations.
Data collection
Demographic data and anthropometric measurements were recorded. BP measurements were taken in the standard fashion. Blood samples of patients were taken for the determination of serum electrolytes, urea, creatinine, fasting blood sugar, and fasting lipid profile.
ECG
All subjects had an ECG. A standard (resting) 12-lead ECG was done according to the recommendations of the American Heart Association/American College of Cardiology/Heart Rhythm Society scientific statement.[15]
All ECG recordings were made using a commercially available Cardiofax (ECG 1550k) ECG machine by Nihon Kohden corporation with a calibration of 25 mm/s (paper speed) and l mV/cm(gain). ECG tracings were read by using manual calipers by the investigator. The following ECG criteria for LVH were used in this study; Sokolow-Lyon voltage criteria,[16] Cornell voltage criteria,[17] Romhilt-Estes point score system,[18] Cornell product criteria,[19] Goldberger criteria,[20] and Massoleini criteria.[21]
Echocardiography
Subjects had echocardiography done at the Cardiology Laboratory of UATH using a General Electronics Healthcare Vivid E (CE 0197), Rev 4, 2010 echocardiography machine. Complete M-Mode guided 2D echocardiographic examination was performed in the left lateral decubitus position by the investigator using the recommendation of the American Society of Echocardiography (ASE),[22] using the leading edge to leading edge technique with simultaneous ECG tracing gating and measurements averaged over three cardiac cycles.
The LVM was calculated according to Devereux – modified ASE Cube formula.[9] The partition value for LVH by echo was determined using the 97th percentile of the LVM values for controls as cutoff point, and LVH deemed to be present by echo for each subject if calculated LVM exceeds this cutoff point. The LVM was indexed to body surface area (BSA) and height. The mean and 97th percentile of the LVM and LVM/BSA for both the subjects and controls were calculated. The 97th percentile of LVM and LVM/ BSA for male control population was calculated to be 231.29 g and 124.6 g/m2, respectively. The LVM and LVM/ BSA 97th percentile for female control were 168.2 g and 106.0 g/m2, respectively. All male hypertensives whose LVM exceeds 231.2 g were considered to have LVH by echo and hypertensive females with LVM ≥168.2 g were also considered to have LVH.
Statistical analysis
Data management and analysis were performed using SPSS version 19.0 (34541001 IBM SPSS Base 19 Win/MAC). Data are presented as means (±SD) for continuous variables and proportions for categorical variables. Echocardiographic LVH was used as the reference standard against which the performance of each of the various ECG criteria was compared for the measurement of their sensitivities, specificities, negative predictive values, and positive predictive values. Differences in prevalence of LVH between subjects and controls were compared using Chi-square (x2) test. Student’s t-test was used to compare means between two groups. Receiver operating characteristic (ROC) curves were constructed for each ECG criteria to evaluate test performance over a wide range of partition values. ECG criteria with ROC values between 0.51 and 1.00 were considered as positive predictors while those with ROC values <0.500 were considered to be negative predictors. P < 0.05 was considered statistically significant.
RESULTS
A total of one hundred and seventy-eight subjects with hypertension and 89 controls were studied. The demographic and clinical characteristics of hypertensive subjects and controls are summarized in [Table 1].
| Parameter | Subject, n=178 Mean (SD) |
Control, n=89 Mean (SD) |
P-value |
|---|---|---|---|
| Age (years) | 51.3 (11.2) | 52.7 (7.1) | 0.280 |
| Height (m) | 1.64 (0.08) | 1.61 (0.08) | 0.004 |
| Weight (kg) | 75.9 (16.3) | 64.8 (11.1) | 0.001 |
| BMI (kg/m2) | 28.0 (6.3) | 24.7 (3.9) | 0.001 |
| BSA (m2) | 1.8 (0.19) | 1.7 (0.16) | 0.001 |
| SBP (mmHg) | 143 (19.5) | 124.4 (4.8) | 0.001 |
| DBP (mmHg) | 88.3 (10.2) | 77.8 (7.6) | 0.001 |
| MAP (mmHg) | 109 (12.6) | 97 (8.3) | 0.001 |
| Pulse rate (b/min) | 78.9 (18) | 76.8 (17.4) | 0.023 |
| Waist circumference (cm) | 93.77 (10.81) | 91.2 (9.95) | 0.005 |
| Hip circumference (cm) | 100.92 (11.83) | 102.6 (10.97) | 0.005 |
| Waist/hip ratio | 0.93 (0.10) | 0.98 (0.12) | 0.024 |
| n(%) | n(%) | ||
| Male Females |
76 (42.7%) 102 (57.3%) |
39 (43.8%) 50 (56.2%) |
BMI: Body mass index, BSA: Body surface area, SBP: Systolic blood pressure, DBP: Diastolic blood pressure, MAP: Mean arterial pressure, SD: Standard deviation
The subjects with hypertension and controls did not differ significantly in age, 51.3 ± 11.2 years versus 52.7 ± 7.1 years, respectively (P = 0.28) as depicted in Figure 1, or gender. There were significant differences between subjects and controls in body mass index (BMI) (28.0 ± 6.3 kg/m2 vs. 24.7 ± 3.9 kg/m2, P = 0.001), BSA (1.8 ± 0.19 m2 vs. 1.7 ± 0.16 m2, P = 0.001), waist circumference (93.77 ± 10.81cm vs. 91.2 ± 9.95 cm, P = 0.005), and hip circumference (100.92 ± 11.83 cm vs. 102.6 ± 10.96 cm, P = 0.005).
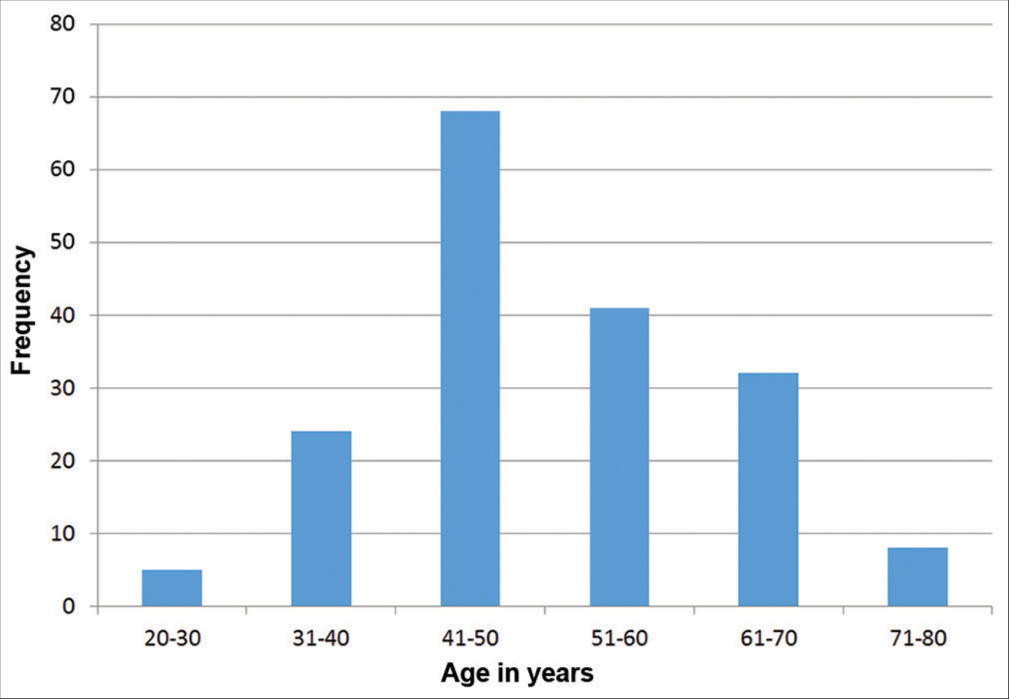
- Age distribution of the study group.
ECG characteristics of the study population
The values of the various ECG parameters of the study population are summarized in [Table 2].
| Parameter | n | Mean | SD |
|---|---|---|---|
| P wave duration (ms) | 178 | 92.84 | 11.56 |
| QRS axis (degree) | 178 | 29.68 | 6.83 |
| QRS duration (ms) | 178 | 89.96 | 11.51 |
| RaVL (mV) | 178 | 0.75 | 0.35 |
| SV3 (mV) | 178 | 1.48 | 0.59 |
| SV1 (mV) | 178 | 1.52 | 0.67 |
| SV2 (mV) | 178 | 1.53 | 0.745 |
| RV5 (mV) | 178 | 1.89 | 0.83 |
| RV6 (mV) | 178 | 1.88 | 0.81 |
| Intrinsic deflection time V5 (ms) | 178 | 37.87 | 9.33 |
| Intrinsic deflection time V6 (ms) | 178 | 38.38 | 9.01 |
| ST depression V4–6 (mm) | 178 | 0.062 | 0.021 |
| T inversion V4–6 (mm) | 178 | 1.84 | 0.37 |
QRS: QRS wave, SV1: S wave in V1, SV2: S wave in lead V2, RV5: R wave in lead V5, RV6: R wave in lead V6
Echocardiographic parameters of hypertensive subjects and controls
The echocardiographic parameters of subjects and controls are shown in [Table 3].
| Parameter | Subject, n=178 Mean (SD) |
Control, n=89 Mean (SD) |
P-value |
|---|---|---|---|
| LVM (g) | |||
| Male | 185.2 (63.7) | 173.2 (51.9) | 0.126 |
| Female | 173.8 (65.2) | 141 (32.1) | 0.0001 |
| All | 178.7 (64.7) | 154.9 (91.1) | 0.01 |
| LVM/BSA (g/m2) | |||
| Male | 99.4 (30.6) | 99.5 (33.2) | 0.715 |
| Female | 98.1 (40.1) | 85.3 (18.8) | 0.005 |
| All | 102.1 (36.2) | 91.4 (26.7) | 0.12 |
| LVM/HT (g/m) | |||
| Male | 119.4 (36.4) | 104.2 (32.2) | 0.001 |
| Female | 109.6 (41.9) | 89.0 (19.1) | 0.001 |
| All | 118.8 (39.5) | 95.6 (26.8) | 0.005 |
| LVIDd (cm) | |||
| Male | 4.63 (0.92) | 4.38 (0.78) | 0.04 |
| Female | 4.57 (0.83) | 4.28 (0.74) | 0.03 |
| All | 4.61 (0.89) | 4.33 (0.79) | 0.03 |
| IVSTd (cm) | |||
| Male | 1.32 (0.21) | 1.13 (0.15) | 0.016 |
| Female | 1.27 (0.17) | 0.99 (0.13) | 0.354 |
| All | 1.28 (0.22) | 1.12 (0.14) | 0.02 |
| LVPWd (cm) | |||
| Male | 1.22 (0.19) | 1.11 (0.12) | 0.010 |
| Female | 1.20 (0.13) | 1.09 (0.11) | 0.474 |
| All | 1.22 (0.21) | 1.10 (0.13) | 0.099 |
LVPWd: Left ventricular posterior wall in diastole, LVIDd: Left ventricular internal diameter in diastole, IVSDd: Interventricular septal diameter in diastole, SD: Standard error, LVM: Left ventricular mass, LVM/BSA: Left ventricular mass indexed to body surface area, LVM/HT: Left ventricular mass indexed to height
Sensitivity, specificity, and negative and positive predictive values of the various ECG criteria
The sensitivities and specificities of the various ECG criteria in the diagnosis of LVH as obtained in this study for total volunteers are summarized in [Table 4].
| ECG criteria | Sensitivity (%) (95% CI) | Specificity (%) (95%CI) | PPV (%) (95%CI) | NPV (%) (95%CI) |
|---|---|---|---|---|
| SL | 28.9 (19.8–9.4) | 64.0 (53.2–74.0) | 44.8 (31.8–58.5) | 50.1 (38.0–58.5) |
| CV | 38.6 (28.1–49.9) | 72.9 (62.9–81.5) | 55.2 (41.5–68.3) | 58.9 (48.5–66.7) |
| RE | 23.5 (12.8–37.5) | 64.1 (55.1–72.4) | 20.7 (11.2–33.4) | 67.8 (58.7–76.0) |
| CDP | 34.6 (24.4–46.0) | 69.4 (59.3–78.3) | 48.3 (35.0–61.8) | 56.2 (46.9–65.2) |
| GC | 34.4 (18.6–53.2) | 68.0 (59.8–75.5) | 19.0 (9.9–31.4) | 82.6 (74.7–88.9) |
| MC | 38.6 (28.1–49.9) | 72.9 (62.9–81.5) | 55.2 (41.5–68.3) | 58.9 (48.5–66.7) |
CI: Confidence interval, ECG: Electrocardiographic, PPV: Positive predictive value, NPV: Negative predictive value, SL: Sokolow-Lyon criteria, CV: Cornell voltage criteria, RE: Romhilt-Estes criteria, CDP: Cornell duration product criteria, GC: Goldberger criteria, MC: Massoleini criteria, LVH: Left ventricular hypertrophy
The sensitivities and specificities obtained were 28.9%, 38.6%, 23.5%, 34.6%, 34.4%, 38.6% and 64.0%, 72.9%, 64.1%, 69.4%, 68.0%, and 72.9% for the Sokolow-Lyon, Cornel voltage, Romhilt-Estes, Cornel duration product, Goldberger, and Massoleini criteria, respectively.
The positive and negative predictive values were 44.8% and 47.1%, 55.2% and 58.9%, 20.7% and 67.8%, 48.3% and 56.2%, 19.0% and 82.6%, and 38.6% and 72.9% for the Sokolow-Lyon, Cornell voltage, Romhilt, Cornell duration product, Goldberger, and Massoleini criteria, respectively.
Area under the ROC curves for the various ECG criteria
The areas under the various ROC curves depicting the combinations of sensitivity and specificity of the various ECG criteria obtained in this study are summarized in [Table 5 and Figures 2-7]. The Sokolow-Lyon criterion had the highest value (0.7010). This was followed by Cornell voltage and Massoleini criteria with values of 0.6040 and 0.5960, respectively. Other values for area under the curve were 0.5950, 0.4790, and 0.4660 for the Romhilt, Goldberger, and Cornell duration product criteria, respectively. Parameters with ROC values between 0.51 and 1.00 depict positive prediction or correlation. Sokolow-Lyon, Cornell voltage, and Massoleini criteria with ROC values of 0.7010, 0.6040, and 0.5960, respectively, are positive predictors and good testing parameters.
| ROC area | SE | 95% CI | |
|---|---|---|---|
| Massoleini | 0.5960 | 0.0512 | 0.496–0.728 |
| Sokolow-Lyon | 0.7010 | 0.0685 | 0.536–0.894 |
| Cornell voltage | 0.6040 | 0.0596 | 0.506–0.745 |
| Romhilt-Estes | 0.5950 | 0.0573 | 0.491–0.652 |
| Goldberger | 0.4790 | 0.063 | 0.356–0.603 |
| Cornell duration product | 0.4660 | 0.044 | 0.380–0.552 |
ROC: Receiver operating characteristic, SE: Standard error, CI: Confidence interval

- Receiver operating characteristic (ROC) curve showing the sensitivity and specificity of the left ventricular hypertrophy by Sokolow-Lyon criteria. Area under the curve = 0.7010. The ROC value is >0.510, it, therefore, shows a combination of high sensitivity and specificity and therefore a positive predictor test.

- Receiver operating characteristic (ROC) curve showing the sensitivity and specificity of the left ventricular hypertrophy by Cornell voltage criteria. Area under the curve = 0.6040. It shows a combination of high sensitivity and specificity with the ROC value >0.51. It is, therefore, a positive predictor criterion.

- Receiver operating characteristic curve showing the sensitivity and specificity of the left ventricular hypertrophy by Romhilt criteria. Area under the curve = 0.5950. It is a positive predictor test because the area under the curve is >0.51, therefore, this criterion also has a combination of high sensitivity and specificity.

- Receiver operating characteristic (ROC) curve showing the sensitivity and specificity of the left ventricular mass by Cornell duration product. Area under the curve = 0.466. This shows a combination of low sensitivity and specificity with ROC value of 0.466 which is <0.51. It is a negative predictor test.

- Receiver operating characteristic (ROC) curve showing the sensitivity and specificity of the left ventricular mass by Goldberger criteria. Area under the curve = 0.479. This is a negative predictor criterion with a combination of low sensitivity and specificity with a ROC value of 0.479 which is lower than 0.510.

- Receiver operating characteristic (ROC) curve showing the sensitivity and specificity of the left ventricular mass by Massoleini criteria. Area under the curve = 0.5960. This depicts positive prediction and a combination of high sensitivity and specificity since the ROC value is 0.5960 which is >0.51.
DISCUSSION
The subjects and controls were similar in gender distribution. This is important because gender has been shown to affect LVM values necessitating the use of different LVM partition values or cutoff points for males and females. Subjects and controls also had similar age distribution (51.3 ± 11.2 vs. 52.7 ± 7.1 years). The mean systolic and diastolic BPs of the hypertensive subjects as expected were significantly higher in the subjects than controls (P = 0.001).
The mean BMI and BSA for the hypertensive subjects were also significantly higher in the subjects than controls. Obesity has been associated with increases in the left ventricular thickness, LVM, and prevalence of echocardiographic LVH independent of the impact of BP levels.[23] The previous studies have also reported decreased prevalence and sensitivity of precordial leads voltage criteria for LVH in obese patients.[24] This is thought to be largely due to attenuating effects of increased distance of exploring electrodes from the left ventricle and attenuation of precordial QRS amplitudes by interposed tissue. This finding is likely to have influenced the utility of some of the voltage criteria used in this study.
Most previous studies show that standard electrocardiographic criteria have low sensitivity and high specificity.[14] In a recent analysis by Pewsner et al. involving 21 studies, for example,[25] the sensitivity of Sokolow-Lyon, Cornell voltage, Cornell product, and Romhilt criteria was 12–52%, 7–41%, 8–32%, and 8–41%, respectively. The specificities for Sokolow-Lyon, Cornell voltage, Cornell product, and Romhilt-Estes criteria were 53–100%, 89– 100%, 83–100%, and 71–100%, respectively. These trends are similar to the observation in the present study.
The Cornell voltage and Massoleini criteria in this study exhibited the highest sensitivity of 38.6% whereas the lowest sensitivity was seen with the Romhilt criterion (23.5%). The Cornell duration product, Goldberger, and Sokolow-Lyon criteria exhibited 34.6%, 34.4%, and 28.9%, respectively, as their sensitivities. The lowest specificity of 64.0% and highest specificity of 72.9% were obtained with the Sokolow-Lyon and Cornell voltage criteria, respectively. Cornell duration product, Goldberger, and Romhilt criteria had 69.4%, 68.0%, and 64.1%, respectively, as their specificities. These values are consistent with the observation that ECG LVH criteria always exhibit high specificities but low sensitivities.[14]
Furthermore, Sokolow-Lyon and the Cornell voltage have the highest combination of sensitivities and specificities in the review by Pewsner et al. This is similar to the findings obtained in the present study as well as that of Dada et al. in Ibadan.[26]
Sokolow-Lyon and the Cornell voltage/Massoleini criteria have been observed in this study to combine the best sensitivity and specificity for routine evaluation of LVH in the hypertensive population studied. The Massoleini criteria which have a single voltage amplitude index are a subcomponent of the Cornell voltage criteria. Hence, the Cornell and Massoleini exhibited similar values of sensitivity and specificity.
The sensitivity and specificity values of the various ECG criteria obtained in this study were similar to the findings from the previous studies of black hypertensives.[27] These results are generally consistent with the observation that in Africans, ECG criteria for LVH usually show increased sensitivity with a reduction in specificity when compared to Caucasians.[28]
Casiglia et al.[29] in their work on ECG/ECHO correlation in a general population comprising both hypertensives and non-hypertensives observed that the Cornell voltage and Sokolow-Lyon criteria were significantly correlated with echocardiographic LVM across all age and systolic BP. This is similar to the findings in the present study. The Cornell voltage, Massoleini, and the Sokolow-Lyon criteria showed good combination of sensitivities and specificities and high negative predictive values in this study as shown by their respective ROC curves. Negative predictive values were 58.9%, 55.2%, and 50.1% for the Cornell voltage, Massoleini, and Sokolow-Lyon criteria, respectively.
It has been recommended that for an effective diagnostic test, the negative and positive predictive values are expected to be above 50%.[29] Low sensitivity and high rate of false negatives have also been stated to be the major limitations of ECG in determining LVH.[29] Due to above reasons, there are currently no firmly established recommendations or guidelines as to whether or not ECG tests can be used as diagnostic and screening tests for LVH. The 2003 European Society of Hypertension/European Society of Cardiology guidelines recommend echocardiography in patients in whom target organ damage is not discovered by routine ECG.[30] The 2004 guidelines from the British Hypertension Society state that echocardiography is not required routinely but is valuable to confirm or refute the presence of LVH when the electrocardiogram shows high left ventricular voltage without T wave abnormalities.[31] In the United States, the seventh report of the Joint National Committee on Prevention, Detection, Evaluation, and Treatment of High BP (JNC 7) recommends routine ECG but makes no mention of echocardiography.[1]
The combination of sensitivities and negative predictive values of the Sokolow-Lyon, Cornell voltage, and Massoleini criteria as obtained in this study, however, is all above 50%, and thus, these criteria have exhibited good performance in the present study though data from further large-scale studies are needed to confirm these observations.
CONCLUSION
Cornell voltage, Sokolow-Lyon, and Massoleini ECG criteria had the highest combination of sensitivities and specificities with the highest ROC values in this study and thus most accurate ECG LVH criteria.
Declaration of patient consent
Patients’ consent not required as patients’ identity is not disclosed or compromised.
Conflicts of interest
There are no conflicts of interest.
Financial support and sponsorship
Nil.
References
- The seventh report of the joint national committee on prevention, detection, evaluation and treatment of high blood pressure: The JNC 7 report. JAMA. 2003;289:2560-72.
- [CrossRef] [PubMed] [Google Scholar]
- Reducing risks, promoting healthy life In: The World Health Report. Geneva: World Health Organization; 2002. p. :48.
- [Google Scholar]
- Obesity as an independent risk factor for cardiovascular disease. A 26-year follow-up of participants in the Framingham heart study. Circulation. 1983;67:968-77.
- [CrossRef] [PubMed] [Google Scholar]
- Continuous relation between left ventricular mass and cardiovascular risk in essential hypertension. Hypertension. 2000;35:580-6.
- [CrossRef] [PubMed] [Google Scholar]
- Cardiac hypertrophy in hypertension. N Engl J Med. 1987;317:831-3.
- [CrossRef] [PubMed] [Google Scholar]
- Left ventricular hypertrophy: Pathogenesis, detection and prognosis. Circulation. 2000;102:470-9.
- [CrossRef] [PubMed] [Google Scholar]
- Regression of electrocardgraphic LVH with antihypertensive treatment. JAMA. 2004;292:2343-9.
- [CrossRef] [PubMed] [Google Scholar]
- Review of left ventricular hypertrophy and hypertension. Niger J Med. 2004;13:8-17.
- [CrossRef] [Google Scholar]
- The role of hypertension in the pathogenesis of heart failure, a clinical mechanistic overview. Arch Intern Med. 1996;56:1789-96.
- [CrossRef] [PubMed] [Google Scholar]
- Left ventricular mass and incidence of coronary heart disease in an elderly cohort: The Framingham heart study. Ann Intern Med. 1989;110:101-7.
- [CrossRef] [PubMed] [Google Scholar]
- Prevalence and natural history of electrocardiographic LVH. Am J Med. 1983;65:4-11.
- [CrossRef] [PubMed] [Google Scholar]
- Prognostic significance of serial changes in left ventricular mass in essential hypertension. Hypertension. 2000;35:580-6.
- [Google Scholar]
- Is the Echocardiogram still useful for detection of LVH? Circulation. 1990;81:1144-6.
- [CrossRef] [PubMed] [Google Scholar]
- A scientific statement from the American heart association electrocardiography and arrhythmias committee, council on clinical cardiology; The American college of cardiology foundation; and the heart rhythm society. Part II: Electrocardiography diagnostic statement list. Circulation. 2007;115:1325-32.
- [CrossRef] [PubMed] [Google Scholar]
- The ventricular complex in left ventricular hypertrophy as obtained by unipolar precordial and limb leads. Am Heart J. 1949;37:161-8.
- [CrossRef] [PubMed] [Google Scholar]
- Electrocardiographic detection of left ventricular hypertrophy: Development and prospective validation of improved criteria. J Am Coll Cardiol. 1985;6:572-80.
- [CrossRef] [PubMed] [Google Scholar]
- A point score system for the ECG diagnosis of left ventricular hypertrophy. Am Heart J. 1968;75:752-8.
- [CrossRef] [PubMed] [Google Scholar]
- Electrocardiographic detection of left ventricular hypertrophy by the simple QRS voltage duration product. J Am Coll Cardiol. 1992;20:1180-6.
- [CrossRef] [PubMed] [Google Scholar]
- Correlation between component cardiac weight and electrocardiographic patterns in 185 cases. Circulation. 1965;30:808-29.
- [CrossRef] [PubMed] [Google Scholar]
- ACC/AHA guidelines for the clinical application of Echocardiography: A report of the American college of cardiology/America heart association. Task force on practice guidelines (committee on clinical application of echocardiography) developed in collaboration with the American society of echocardiography. Circulation. 1997;95:1686-744.
- [CrossRef] [PubMed] [Google Scholar]
- Relations of left ventricular mass to fat free and adipose body mass: The strong heart study. Circulation. 1998;98:2538-44.
- [CrossRef] [PubMed] [Google Scholar]
- Determinants of sensitivity and specificity of electrocardiographic criteria for left ventricular hypertrophy. Circulation. 1990;81:815-20.
- [CrossRef] [PubMed] [Google Scholar]
- Accuracy of electrocardiography in diagnosis of left ventricular hypertrophy in arterial hypertension: Systematic review. BMJ. 2007;335:711-20.
- [CrossRef] [PubMed] [Google Scholar]
- Standard electrocardiographic criteria for LVH in Nigerian hypertensives. J Ethn Dis. 2005;15:578-84.
- [Google Scholar]
- Performance of classic electrocardiographic criteria for left ventricular hypertrophy in an African population. Hypertension. 2000;36:54-61.
- [CrossRef] [PubMed] [Google Scholar]
- Ethnic differences in the hypertensive heart and 24 Hour BP profile. Hypertension. 1998;31:1190-4.
- [CrossRef] [PubMed] [Google Scholar]
- Electrocardiographic criteria for left ventricular hypertrophy in general population. Eur J Epidemiol. 2008;10:34-6.
- [CrossRef] [PubMed] [Google Scholar]
- 2003 European society of hypertension-European society of cardiology guidelines for the management of arterial hypertension. J Hypertens. 2003;21:1011-53.
- [CrossRef] [PubMed] [Google Scholar]
- Guidelines for management of hypertension: Report of the fourth working party of the British hypertension society, 2004-BHS IV. J Hum Hypertens. 2004;18:139-85.
- [CrossRef] [PubMed] [Google Scholar]